On a raspberry pi in python, it is not possible to produce accurate timings in μs range. The question is how accurate the timing is in real live.
The issue was raised by someone asking a question in raspberry pi forum on an 80Hz timing loop “the values may not always be accurate at the milliseconds level”.
To measure this, a simple timing loop was set up in python, and the timing was measured with the help of an arduino due. The arduino due runs at 84MHz and is ideal as a versatile measuring tool for this sort of problems.
Python timing loop. The loop should produce a square wave with 12.5ms or 80Hz.
import RPi.GPIO as GPIO
import time

GPIO.setmode(GPIO.BCM)
GPIO.setwarnings(False)

pin_AO = 17
GPIO.setup(pin_AO, GPIO.OUT)

dt = 0
diff = 0.0115
while True:
    drun = diff - dt

    t0 = time.time()
    for _ in range(0, 1000):
        GPIO.output(pin_AO, GPIO.LOW)
        time.sleep(0.001)
        GPIO.output(pin_AO, GPIO.HIGH)
        time.sleep(drun)
    t1 = time.time();
    # calculate the deviation from ideal value 12.5 ms.
    dt = (t1 - t0) / 1000 - 0.0115 - 0.001
    print(dt)
The idea is to adjust timing based on average of last 1000 pulses.
The output of the arduino due is printed to Serial and looks like (values in μs):
...
12508
12509
12509
12514
12513
12516
12513
12509
12510
12512
12510
12515
12510
12515
12514
12515
12508
12512
12508
12514
12514
...
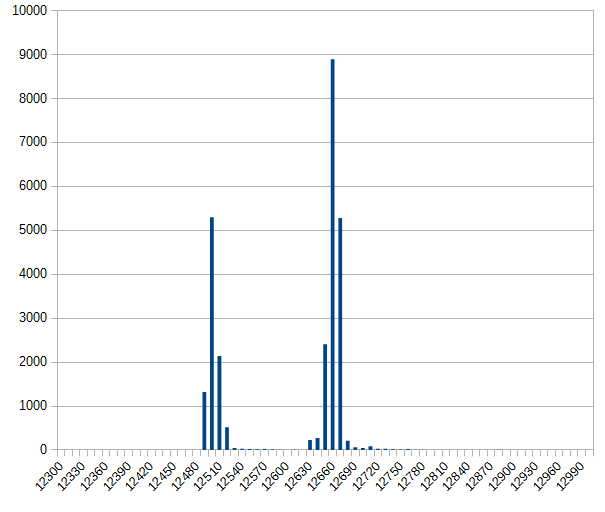
Grouping the output values into 10 μs slots and calculating the the number of events per group yields this bar chart. There are prox 27.000 events included the chart.
X-axis is slot times in μs; y-axis is count of events in the slot.
The printout of the script is (shortened)
9.77396965027e-06
0.000155053138733
1.0488986969e-05
0.000154378175735
1.00150108337e-05
0.000154267787933
9.80496406555e-06
0.000156002044678
8.39877128601e-06
0.000155970096588
This demonstrates some oscillation. Values like 0.00015 and ‘something- e-05’ are repeating. The two peaks in the diagram reflect this behavior.
Summary: precise timing with loops in python is accurate only to prox 0.2 ms.
